Math 511: Linear Algebra
Project Exploring Multiplication
Table 1
| Test 1 | Test 2 | |
|---|---|---|
| Anna | 84 | 96 |
| Bruce | 56 | 72 |
| Chris | 78 | 83 |
| David | 82 | 91 |
The table shows the first two test scores for Anna, Bruce, Chris, and David. Use the table to create a matrix $M$ to represent the data. Input $M$ into a software program or a graphing utility and use it to answer the questions below.
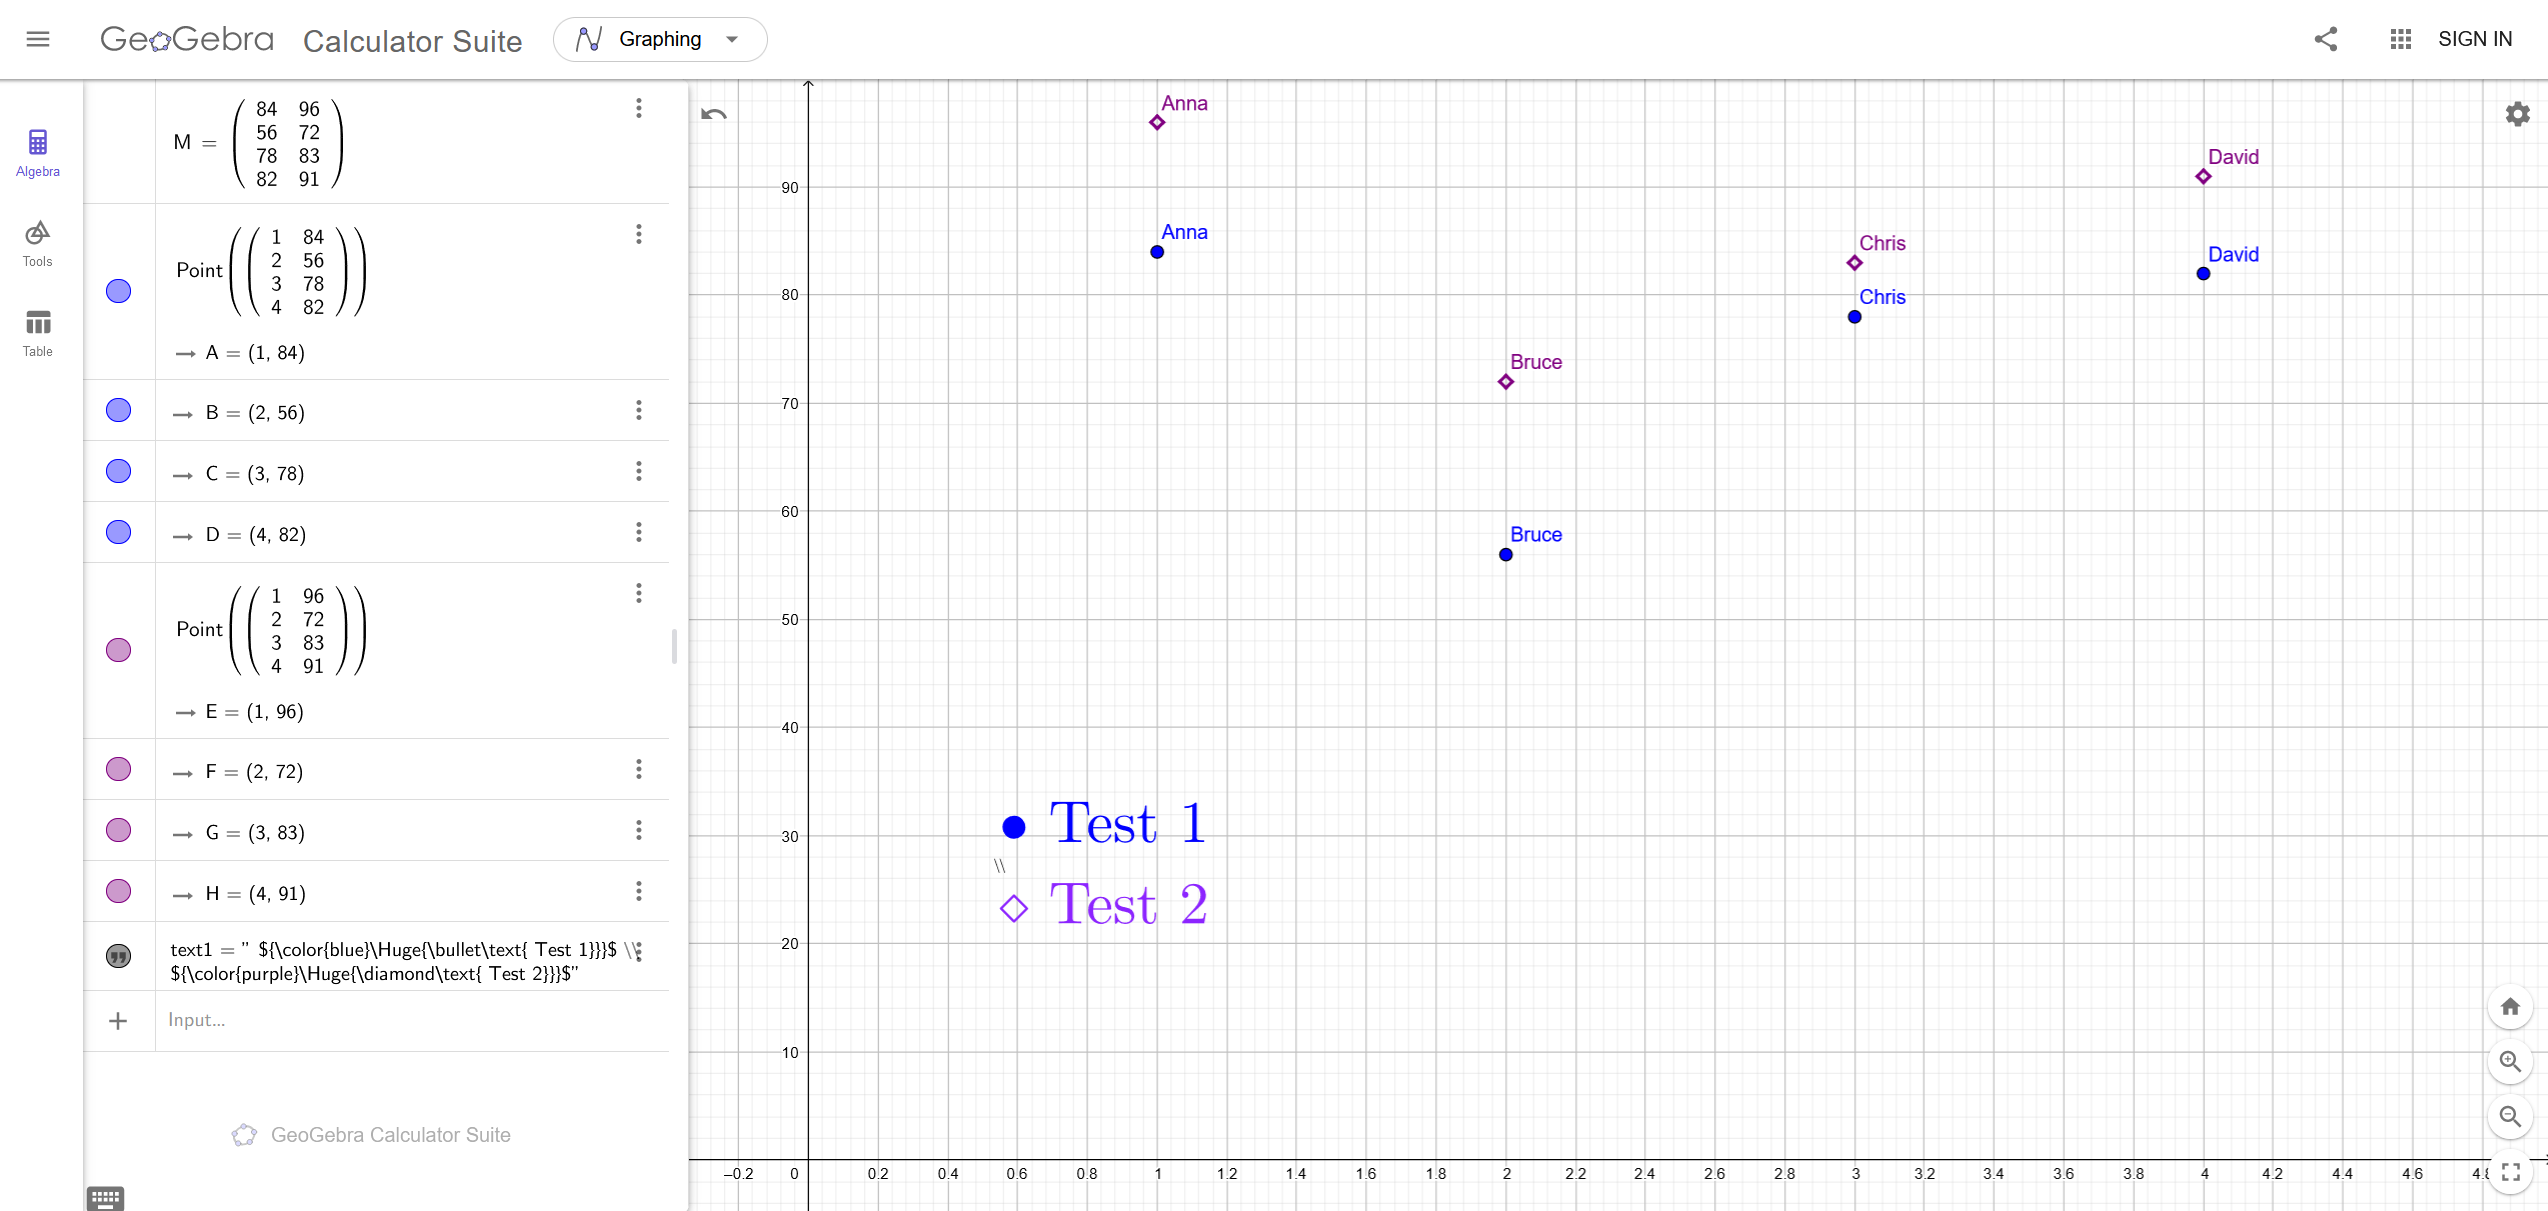
Using Geogebra one can create a matrix $M$ and plot the scores,

The matrix $M$ has columns ${\color{blue}{\begin{bmatrix} 84\\56\\78\\82 \end{bmatrix}}}$ that represents the ${\color{blue}{\text{Test 1}}}$ scores, and ${\color{purple}{\begin{bmatrix} 96\\72\\83\\91 \end{bmatrix}}}$ that represents the ${\color{purple}{\text{Test 2}}}$ scores.
$$
M = \begin{bmatrix} 84 & 96 \\ 56 & 72 \\ 78 & 83 \\ 82 & 91 \end{bmatrix}
$$
1.
Which test was more difficult? Which was easier? Explain.
2.
How would you rank the performances of the four students.
3.
Describe the meanings of the matrix products $M\begin{bmatrix} 1 \\ 0 \end{bmatrix}$ and $M\begin{bmatrix} 0 \\ 1 \end{bmatrix}$. This does not mean describe their algebraic result. Explain what the result represents.
4.
Describe the meanings of the matrix products $\begin{bmatrix} 1 & 0 & 0 & 0 \end{bmatrix}M$ and $\begin{bmatrix} 0 & 0 & 1 & 0 \end{bmatrix}M$
5.
Describe the meaning of the matrix product $M\begin{bmatrix}1\\1\end{bmatrix}$ and $\frac{1}{2}M\begin{bmatrix}1\\1\end{bmatrix}$.
6.
Describe the meanings of the matrix products $\begin{bmatrix} 1&1&1&1 \end{bmatrix}M$ and $\frac{1}{4}\begin{bmatrix} 1&1&1&1 \end{bmatrix}M$
7.
Describe the meaning of the matrix product $\begin{bmatrix} 1 & 1 & 1 & 1 \end{bmatrix}M\begin{bmatrix} 1 \\ 1 \end{bmatrix}$.
8.
Use matrix multiplication to find the combined overall average score on both tests.
9.
How could you use matrix multiplication to scale the scores on test 1 by a factor of 1.1?